this post was submitted on 15 Oct 2024
10 points (100.0% liked)

Golang

22 readers
1 users here now

This is a community dedicated to the go programming language.

Useful Links:

Rules:

founded 1 year ago
MODERATORS
 

I'm fairly new to go and I've recently migrated a in-memory cache from node to go for concurrency improvements, but the memory usage difference between the two are huge. I've tried to read up on the map memory model in go but haven't been able to find a reason for the difference. I can't see that I'm doing anything special, so I'm looking for guidance here.

The documents that are stored are around 8 KB in size as a JSON file. In node the memory usage for 50000 documents stored as objects is 1,5 GB, and for go maps it is 10 GB.

To me, this doesn't seem reasonable but I can't find the source of the difference. Could anyone here give their take on this?

top 4 comments
sorted by: hot top controversial new old
[–] nemith@programming.dev 5 points 1 month ago (1 children)

How are you measuring memory storage size? Are you sure you are looking as resident memory size and not just the virtual memory size?

Actual storage of the structures should be nothing. Interfaces are "fat pointers" but that should really just be an extra word which node would have at least that if not more.

My guess is that if you are looking at virtual memory that more memory/garbage is produced in PARSING and not storing and that the virtual memory size allocated is high even after garbage collection but RSS should be different.
[–] bia@programming.dev 1 points 1 month ago

I'm looking at the memory reported by metrics-server in EKS, as that what I base the container resource scaling on. Maybe the go process is reporting memory in a way that doesn't represent the "actual" usage. But I'm not sure it matters here, unless I can get it to change the reported memory usage.

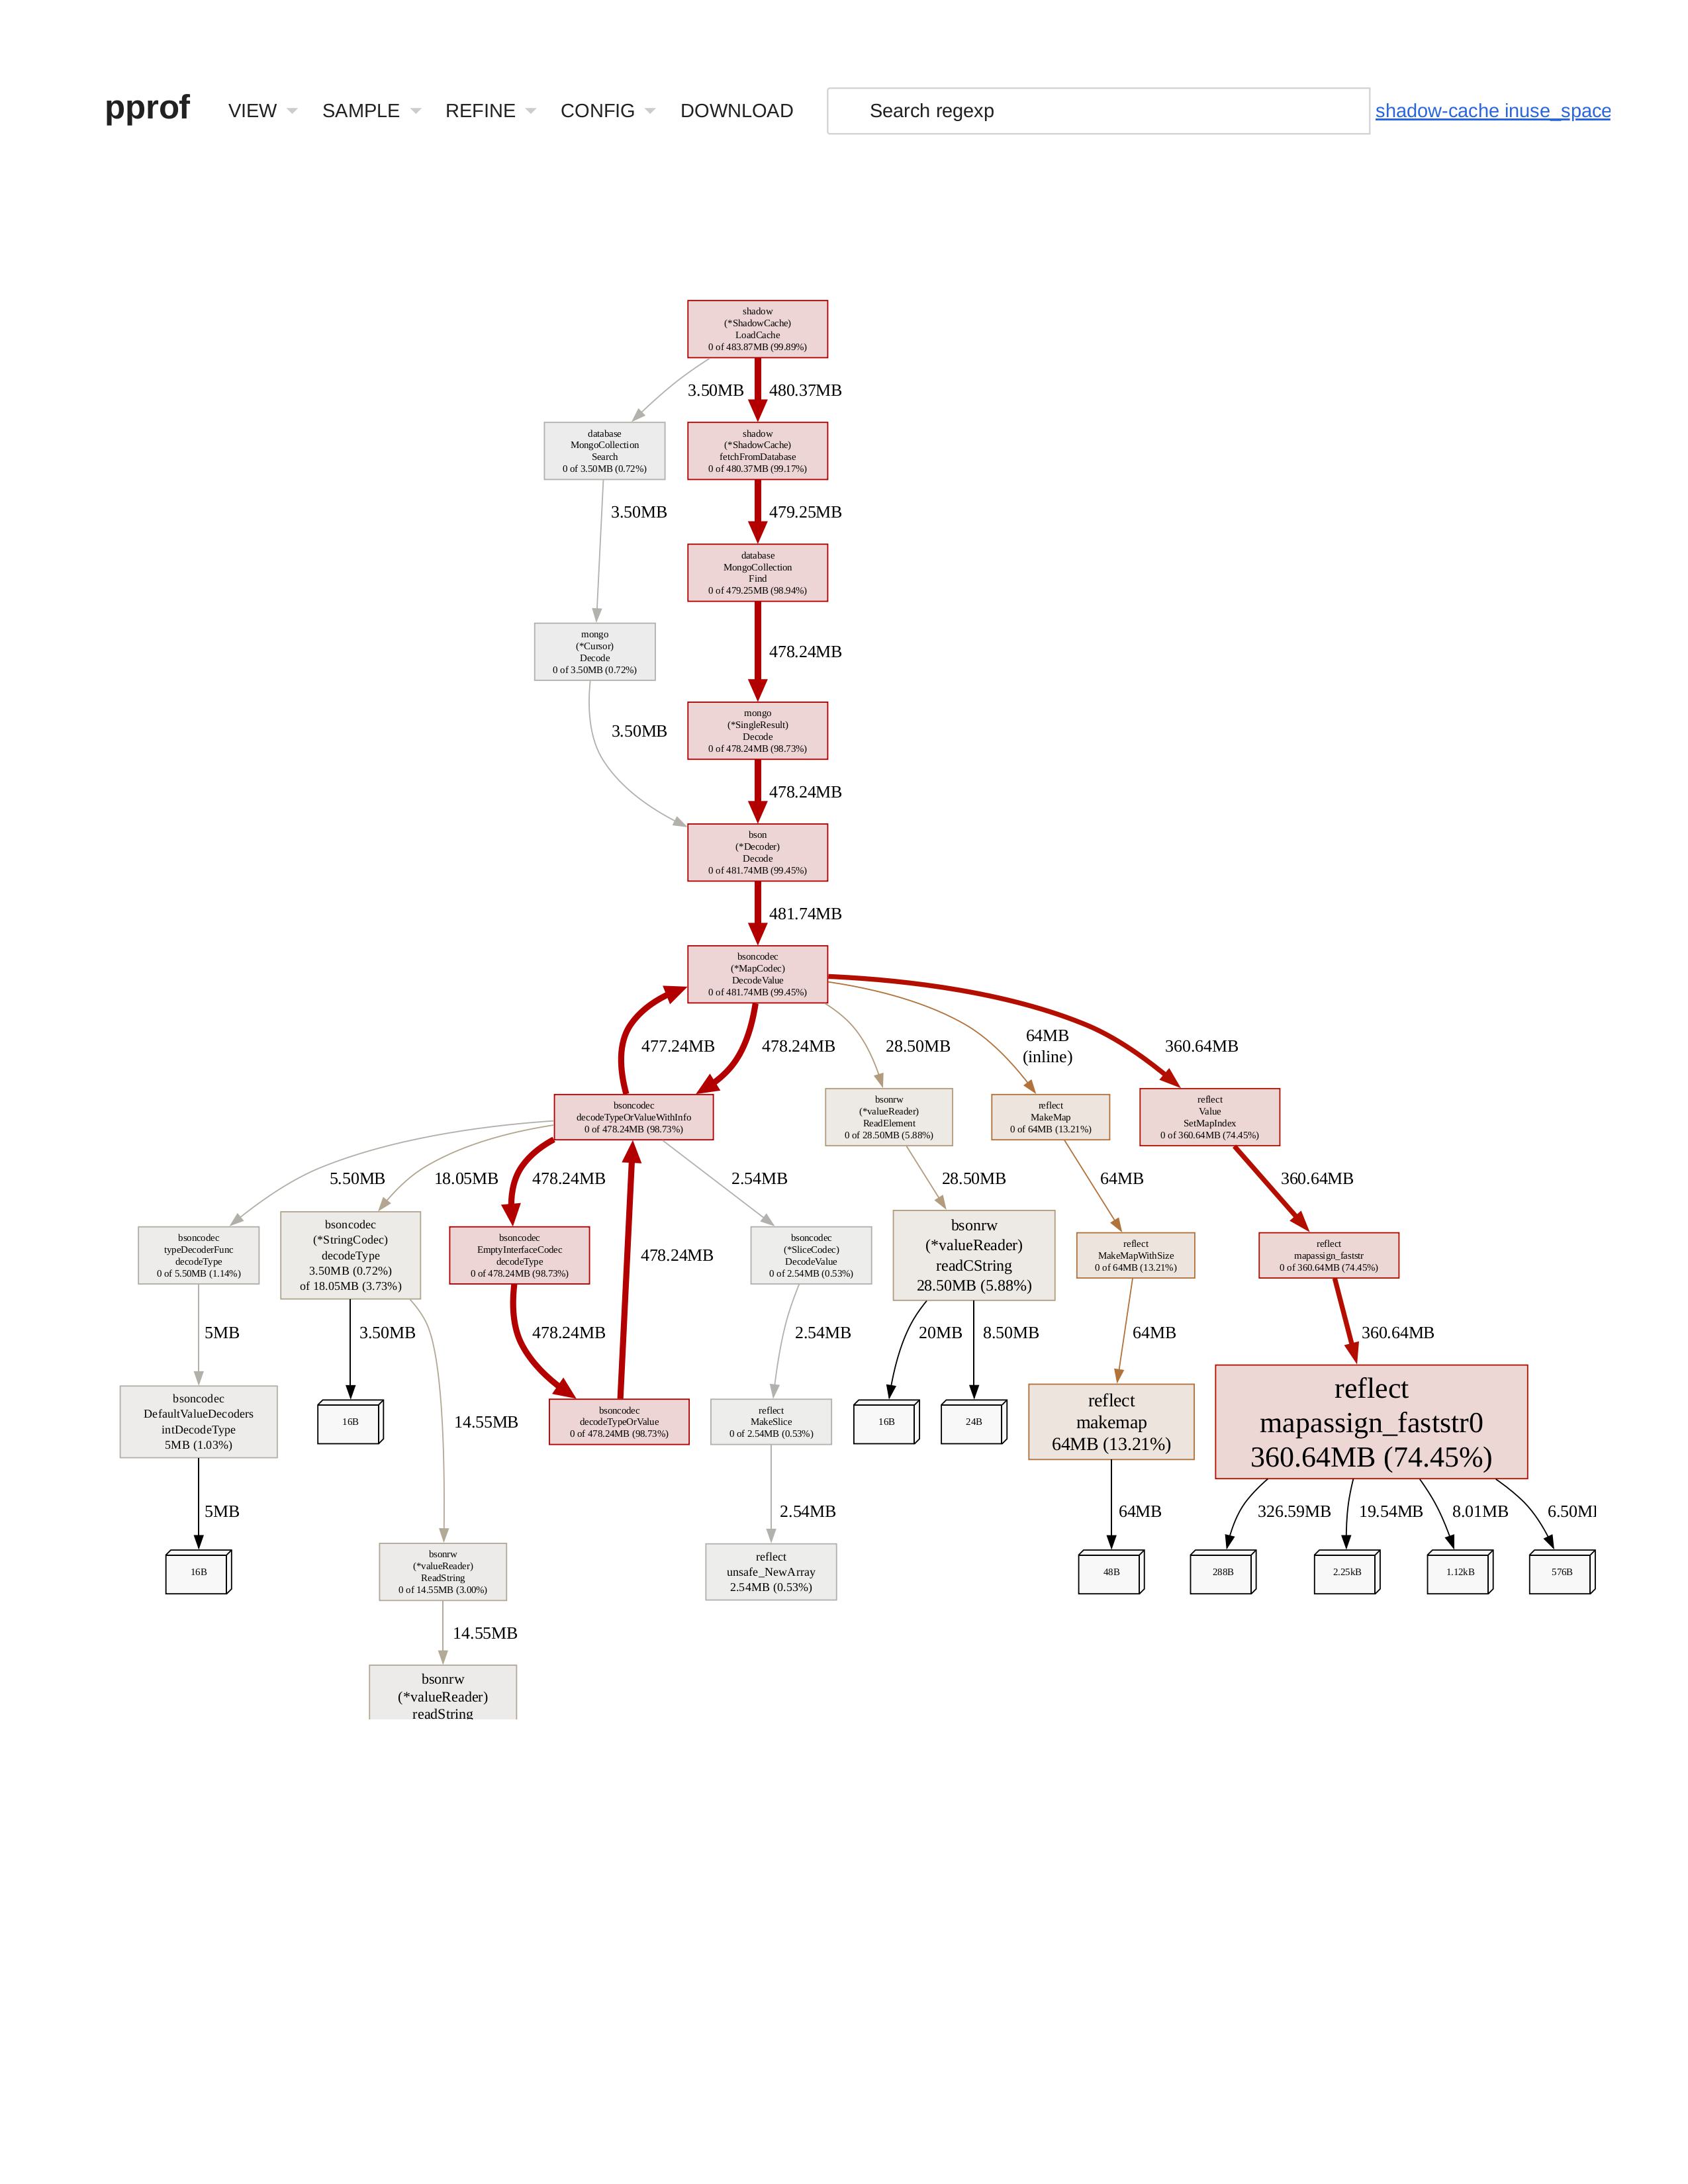
Please see the heap dump I added for 10000 devices. Reported memory is 1,1 GB.

[–] kamstrup@programming.dev 2 points 1 month ago

Interesting observation! The most simple explanation would be that it is memory claimed by the Go runtime during parsing of the incoming bson from Mongo. You can try calling runtime.GC() 3 times after ingest and see if it changes your memory. Go does not free memory to the OS immediately, but this should do it.

2 other options, a bit more speculative:

Go maps have been known to have a bit of overhead in particular for small maps. Even when calling make() with the correct capacity. That doesn't fit well with the memory profile you posted well, as I didn't see any map container memory in there...

More probable might be that map keys are duplicated. So if you have 100 maps with the key "hello" you have 100 copies of the string "hello" in memory. Ideally all 100 maps qould share the same string instance. This often happens when parsing data from an incoming stream. You can either try to manually dedup the stringa, see if the mongo driver has the option, or use the new 'unique' package in Go 1.23

[–] bia@programming.dev 1 points 1 month ago

heap dump from pprof